
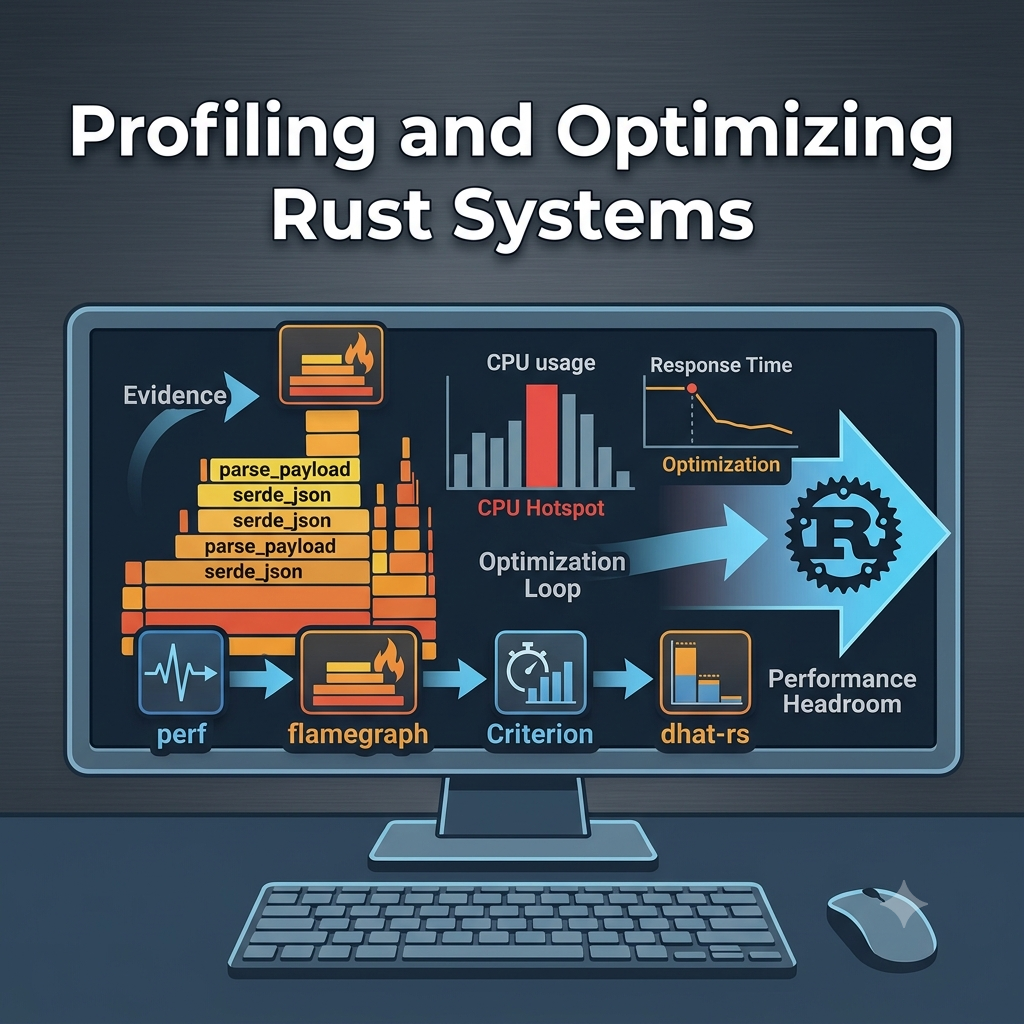
Rust gives you a lot of performance headroom by default.
No garbage collector is pausing your application at unpredictable moments. You get zero-cost abstractions, deterministic memory management, and direct control over how data is stored and moved through your program.
But writing something in Rust does not automatically make it fast.
A Rust application can still become slow because of an unnecessary .clone() inside a hot loop, a lock that is held longer than expected, an inefficient algorithm, excessive logging, repeated string allocation, or a data structure that does far more work than the problem actually requires.
The difficult part is that these issues are not always obvious when reading the code.
A function may look harmless but run millions of times. A small allocation may seem insignificant until it happens for every frame, message, request, or database row. A mutex may be held for only a few milliseconds, but under concurrent load, those milliseconds can become a serious bottleneck.
That is why profiling matters.
Profiling replaces assumptions with evidence. Instead of saying:
“I think this function is slow.”
you can say:
“This function accounts for 38% of total CPU time.”
That is a much better place to begin optimizing.
This blog walks through the tools developers commonly use to profile Rust applications, what each tool is good at, and how to interpret the results without optimizing the wrong thing.
Start With a Release Build
Before using any profiler, make sure you are profiling an optimized build.
This sounds obvious, but it is one of the most common mistakes people make when investigating Rust performance.
Debug builds are designed for development, not speed. Compiler optimizations are mostly disabled, inlining is limited, and additional runtime checks may remain enabled. As a result, a debug build can behave very differently from the binary you eventually run in production.
Build the application in release mode:
cargo build --release
Your optimized binary will usually be available under:
target/release/
For example:
./target/release/your_app
If you want profiling tools to map machine instructions back to readable Rust symbols and source locations, enable debug information for the release profile.
Add this to Cargo.toml:
[profile.release]
debug = true
This does not turn off release optimizations. It simply preserves debugging information so tools such as perf, flamegraphs, and debuggers can produce more useful output.
For deeper stack traces, it can also help to preserve frame pointers:
[profile.release]
debug = true
Then build with:
RUSTFLAGS="-C force-frame-pointers=yes" cargo build --release
Frame pointers are not mandatory in every environment, but they often improve the quality of collected call stacks.
The main rule is simple:
Profile the binary that behaves as closely as possible to the one you actually deploy.
CPU Profiling With perf
If your application is consuming too much CPU or processing work more slowly than expected, CPU profiling is usually the best place to start.
On Linux, perf is one of the standard tools for this job.
perf is a sampling profiler. Instead of instrumenting every function call, it periodically checks what the CPU is executing. After collecting enough samples, it can show where the program spent most of its time.
That makes it useful for profiling real applications with relatively low overhead.
A basic recording session looks like this:
perf record -g ./target/release/your_app
The -g option records call graphs.
After the application finishes, inspect the report:
perf report
You will see a list of functions ordered by how much CPU time they consumed.
You might be surprised by where the time actually goes. Sometimes it’s parsing data, converting JSON, allocating memory, formatting strings, processing images, talking to the database, waiting on locks, or simply copying the same data more often than necessary.
The difficulty with a plain perf report is that large applications can produce a lot of data. You may see hundreds of functions, including runtime internals, system libraries, and compiler-generated symbols.
That is where flamegraphs become useful.
Turning CPU Samples Into a Flamegraph
A flamegraph is one of the most approachable ways to understand CPU profiling data.
The easiest way to generate one for a Rust application is through cargo-flamegraph.
Install it with:
cargo install flamegraph
Then run:
cargo flamegraph --bin your_app
If the project contains only one binary, this may be enough:
cargo flamegraph
For applications that require arguments:
cargo flamegraph --bin your_app -- --config config.toml
Everything after -- is passed to your program.
After execution, the tool usually generates a file named:
flamegraph.svg
Open it in a browser.
How to Read a Flamegraph
Flamegraphs can look intimidating the first time you open one, but the basic idea is straightforward.
Each rectangle represents a function.
The rectangles stacked above it represent functions called by that function.
The width of a rectangle represents the proportion of sampled CPU time spent in that function and the work underneath it.
A wider block means more CPU time.
A taller stack does not necessarily mean the code is slower. Height mainly represents call-stack depth.
Suppose you see something like this:
main
└── process_messages
    └── parse_payload
        └── serde_json::from_slice
If serde_json::from_slice occupies a large percentage of the graph, JSON parsing may be a major cost in your workload.
But that does not immediately mean the JSON library is inefficient. It could mean you are parsing the same data more than once, that the messages are larger than expected, that the function is called far more frequently than necessary, that the workload should use a binary format instead, that parsing is happening on a latency-sensitive thread, or that data could be reused instead of reconstructed. A flamegraph identifies where time is going. It does not automatically tell you why. That investigation is still your job.
Look for Unexpectedly Wide Functions
The most useful parts of a flamegraph are often not the functions you expected to be expensive.
If you are processing video frames, you may expect image decoding or inference to dominate CPU usage.
But the graph might reveal that a large amount of time is actually spent in cloning metadata, formatting log messages, serializing JSON, resizing buffers, allocating strings, locking shared state, or converting between data formats.
Those findings are valuable because they expose overhead around the main workload.
The expensive computation may be unavoidable. The accidental supporting work often is not.
For example, this code may appear harmless:
for item in items {
    process(item.clone());
}
If item contains a large String, Vec, or nested structure, that clone may allocate and copy data on every iteration.
Depending on what process needs, you may be able to pass a reference instead:
for item in &items {
    process(item);
}
The profiler helps you determine whether that change is worth making.
perf Permissions on Linux
On some Linux systems, perf may fail with a permissions error.
You can inspect the current setting with:
cat /proc/sys/kernel/perf_event_paranoid
A restrictive value may prevent access to profiling events.
For a temporary change:
echo 0 | sudo tee /proc/sys/kernel/perf_event_paranoid
Some environments may require a different value depending on kernel configuration and security requirements.
Be careful when changing this on shared or production systems. Lowering the restriction can expose additional system-level profiling information to local users.
For development machines, it is usually manageable. For production servers, coordinate with whoever owns the system security policy.
Benchmarking With Criterion
A profiler tells you where time is being spent across a real program run.
A benchmark answers a different question:
Did this specific implementation get faster or slower?
Once you identify a suspicious function, isolating it in a benchmark gives you a fast feedback loop.
Criterion is one of the most widely used benchmarking libraries in the Rust ecosystem.
Add it to your development dependencies:
[dev-dependencies]
criterion = "0.5"

[[bench]]
name = "my_benchmark"
harness = false
Create a benchmark file:
benches/my_benchmark.rs
Then add a benchmark:
use criterion::{
    black_box,
    criterion_group,
    criterion_main,
    Criterion,
};

fn fibonacci(n: u64) -> u64 {
    match n {
        0 => 0,
        1 => 1,
        n => fibonacci(n - 1) + fibonacci(n - 2),
    }
}

fn bench_fibonacci(c: &mut Criterion) {
    c.bench_function("fibonacci 20", |b| {
        b.iter(|| fibonacci(black_box(20)))
    });
}

criterion_group!(benches, bench_fibonacci);
criterion_main!(benches);
Run it with:
cargo bench
Criterion performs repeated measurements instead of timing the function only once.
It also accounts for warm-up time, measurement noise, statistical variation, outliers, and performance changes between runs.
This makes it much more reliable than using std::time::Instant around a function and trusting a single measurement.
Why black_box Matters
The compiler is very good at removing work that does not affect the final output.
That is normally a benefit.
In benchmarks, however, it can produce misleading results.
For example:
b.iter(|| fibonacci(20));
If the compiler determines that the result is unused and the computation can be simplified or eliminated, your benchmark may no longer measure what you intended.
black_box makes the value opaque enough to reduce the chance of that optimization:
b.iter(|| fibonacci(black_box(20)));
You can also wrap the output:
b.iter(|| black_box(fibonacci(20)));
black_box is not magic, but it is an important part of writing benchmarks that more accurately reflect real execution.
Benchmark Realistic Inputs
A benchmark is only useful when the workload resembles the real problem.
Suppose your production application processes JSON payloads between 50 KB and 500 KB, but your benchmark parses a 20-byte object.
The benchmark may be technically correct while still telling you very little about production performance. Use representative inputs: realistic payload sizes, realistic collection sizes, realistic string lengths, realistic concurrency, realistic cache behavior, and realistic data distributions.
It is also worth testing multiple input sizes.
Criterion supports benchmark groups, which makes comparisons easier:
use criterion::{
    black_box,
    BenchmarkId,
    Criterion,
};

fn bench_inputs(c: &mut Criterion) {
    let mut group = c.benchmark_group("process_payload");

    for size in [100, 1_000, 10_000] {
        let input = vec![1_u8; size];

        group.bench_with_input(
            BenchmarkId::from_parameter(size),
            &input,
            |b, input| {
                b.iter(|| process(black_box(input)))
            },
        );
    }

    group.finish();
}
This can reveal that an implementation performs well for small inputs but scales poorly as the workload grows.
Memory Profiling With dhat-rs
Rust does not have a garbage collector, but that does not mean memory allocation is free.
Heap allocation still involves allocator overhead, bookkeeping, synchronization, and often copying or initialization.
In a hot path, repeated allocations can become a serious performance issue.
dhat-rs is useful for finding where heap allocations originate.
Add the dependency:
[dependencies]
dhat = "0.3"
Then configure it as the global allocator:
#[global_allocator]
static ALLOC: dhat::Alloc = dhat::Alloc;

fn main() {
    let _profiler = dhat::Profiler::new_heap();

    run_application();
}
When the profiler is dropped, it writes a file named:
dhat-heap.json
Open that file in a compatible DHAT viewer.
The report can help answer questions such as:
- Which call site allocates the most bytes?
- Which call site performs the most allocations?
- Which allocations remain live for a long time?
- Are temporary buffers being recreated repeatedly?
- Is a
Stringgrowing through several reallocations? - Is a collection retaining much more capacity than it needs?
Profiling Async Rust Applications
Async Rust introduces another layer of complexity.
In a synchronous application, a function blocks until its work is complete.
In an async application, a future may be polled, pause while waiting, and resume later. Many tasks may share a relatively small number of runtime threads.
Traditional CPU profiles can still be useful, but they may show a large amount of time inside functions such as:
tokio::runtime
poll
park
wake
That tells you the runtime is active, but it may not tell you which task is delayed, repeatedly waking, or blocking progress.
For Tokio applications, tokio-console provides task-level visibility.
Add the subscriber:
[dependencies]
console-subscriber = "0.4"
Initialize it early in the application:
fn main() {
    console_subscriber::init();

    // Start the runtime or application.
}
In many applications, the initialization happens before the Tokio runtime begins doing meaningful work.
You then run the application with Tokio’s tracing instrumentation enabled and connect using the tokio-console client in another terminal.
The Problem With Blocking Work in Async Code
One of the most common async performance problems is running blocking work directly on a runtime worker thread.
For example:
async fn process_request() {
    let result = expensive_cpu_function();
    save(result).await;
}
If expensive_cpu_function() performs heavy CPU work, it blocks the Tokio worker thread until it finishes.
Other tasks scheduled on the same worker may be delayed.
For blocking or CPU-intensive work, you may need a dedicated blocking thread pool:
let result = tokio::task::spawn_blocking(|| {
    expensive_cpu_function()
})
.await?;
This does not automatically make the operation faster. It prevents the blocking work from monopolizing an async executor thread.
For sustained CPU-bound workloads, a dedicated thread pool or parallel computation library may be more appropriate.
The profiler and Tokio Console help you see whether the runtime is being blocked or starved.
Lock Contention
Rust’s ownership model prevents data races, but it does not prevent lock contention.
A mutex can be perfectly safe and still become a performance bottleneck.
Consider:
let mut state = shared_state.lock().unwrap();

perform_expensive_work(&mut state);
write_to_disk(&state);
The lock remains held while expensive work and disk I/O occur.
Any other thread needing that lock must wait.
A better approach may be to keep the critical section small:
let local_data = {
    let state = shared_state.lock().unwrap();
    extract_required_data(&state)
};

perform_expensive_work(&local_data);
write_to_disk(&local_data);
Whether this is possible depends on the application, but the principle is useful:
Protect shared state only for as long as necessary.
Lock contention may appear in a CPU profile through synchronization functions, futex operations, parking, or runtime scheduling functions.
However, waiting threads do not always appear as obvious CPU hotspots. Application tracing and lock-specific profiling may be needed to understand the full picture.
Use Realistic Workloads
A profiler is only as useful as the workload you give it.
If you profile an application for two seconds using a tiny test input, the result may have little connection to production behavior.
Real workloads affect cache usage, branch prediction, allocation patterns, thread scheduling, lock contention, database behavior, network latency, queue depth, input size, and error frequency.
Try to reproduce the conditions under which the problem actually occurs.
For a server, that may mean generating concurrent requests.
For a data pipeline, it may mean processing representative files.
For an inference service, it may mean using real frame sizes, models, and batch sizes.
For an MQTT or event-processing service, it may mean replaying realistic message volume and payload distribution.
Synthetic tests are useful, but they should represent the production workload closely enough to expose the same bottleneck.
Measure Before and After Every Change
Performance optimization should be iterative.
A practical cycle looks like this:
- Reproduce the performance problem.
- Measure the current behavior.
- Identify the largest bottleneck.
- Make one focused change.
- Measure again.
- Compare the results.
- Repeat if necessary.
Avoid changing several things at once.
If you replace a data structure, reduce logging, change concurrency, and rewrite an algorithm in the same commit, it becomes difficult to know which change produced the improvement.
It also becomes difficult to identify the cause if performance gets worse.
Criterion is useful for isolated functions.
Flamegraphs are useful for the full application.
Memory profilers help verify allocation changes.
Application metrics help confirm whether the improvement matters under real load.
Choosing the Right Tool
Here is a practical way to decide which profiler to use.
| Problem | Tool |
|---|---|
| High CPU usage | perf |
| General CPU hotspots | cargo-flamegraph |
| Comparing two implementations | Criterion |
| Detecting benchmark regressions | Criterion |
| Excessive heap allocations | dhat-rs |
| Memory growth over time | Valgrind Massif |
| Slow or stuck Tokio tasks | tokio-console |
| Lock or request-level latency | Tracing and application metrics |
No single tool gives you the entire picture.
A complete performance investigation often combines several of them.
Final Thoughts
Rust gives you the tools to build fast and efficient software, but performance isn’t something you should assume. The compiler can’t tell you if you’re cloning data unnecessarily, holding a lock for too long, or doing more work than your application actually needs.
That’s why profiling matters. It replaces assumptions with real data and helps you focus on the changes that will have the biggest impact.
The best approach is simple: reproduce the problem, measure it, make one focused improvement, and measure again. Rust provides the performance. Profiling helps you make the most of it.
Reach out to us for help profiling and optimizing your Rust systems. We are just a message away.