In modern manufacturing, weld quality directly affects product reliability, safety, and production efficiency. A defective weld can lead to rework, scrap, product failure, downtime, and costly issues downstream.
Traditional weld inspection relies on manual checks, destructive testing, or post-process quality validation. These methods are useful, but they are not always fast enough for high-throughput production lines. By the time a defect is identified, the process may have already allowed many more parts to pass through.
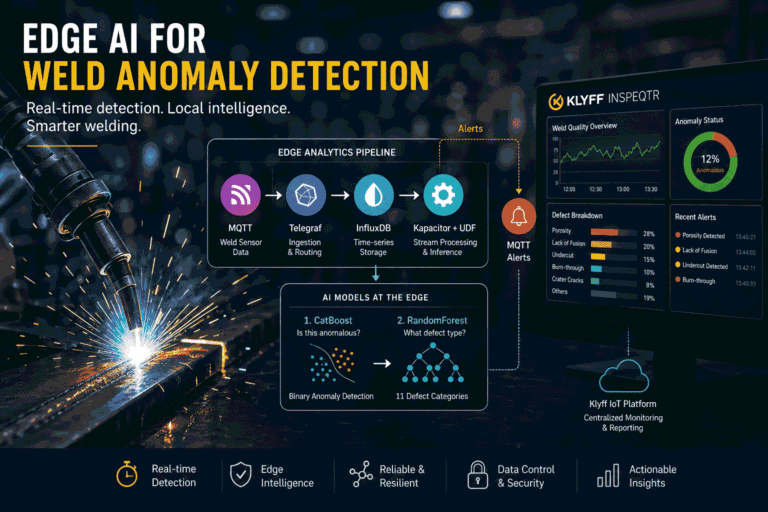
In this blog, we walk through a real-time Weld Anomaly Detection system that runs at the edge. The system ingests weld sensor data, detects abnormal weld patterns using a CatBoost machine learning model, stores raw and processed telemetry, publishes MQTT alerts, and forwards telemetry to devices for centralized monitoring and alerting.
This pipeline integrates seamlessly with Analyzr for real-time telemetry visibility, Inspeqtr for automated quality inspection and defect tracking, Prescptr for enabling predictive maintenance insights from weld signals, and Senatr for scaling model improvements across multiple plants through federated learning.
The goal is simple: detect weld anomalies as they happen, near the machine, while enabling plant-wide intelligence without relying on cloud inference.
Why Edge AI for Weld Anomaly Detection
Cloud-based analytics can look attractive, but weld monitoring is a time-sensitive use case in industry. Sending all sensor data to the cloud before making a decision creates practical challenges and limits real-time responsiveness.
Latency: Weld processes generate fast-changing signals such as current, voltage, gas flow, pressure, feed, and wire consumption. Waiting for a cloud round-trip can delay anomaly detection and reduce the usefulness of real-time intervention.
Bandwidth: Continuous-time series streams from many welding stations can generate heavy network traffic. Sending only processed telemetry and alerts is much more efficient than moving every raw signal to a remote system.
Reliability: Factory networks are not always perfect. If internet connectivity drops, cloud-dependent inspection may slow down or stop. Edge processing keeps detection running locally.
Data control: Manufacturing telemetry can reveal process settings, production behavior, and operational patterns. Keeping inference local helps reduce unnecessary data exposure.
How Edge AI Solves This
In this system, the anomaly detection pipeline runs on an edge deployment. Sensor data is continuously ingested and processed to generate real-time insights. The platform analyzes incoming signals using a machine learning model to classify each weld data point as normal or anomalous.
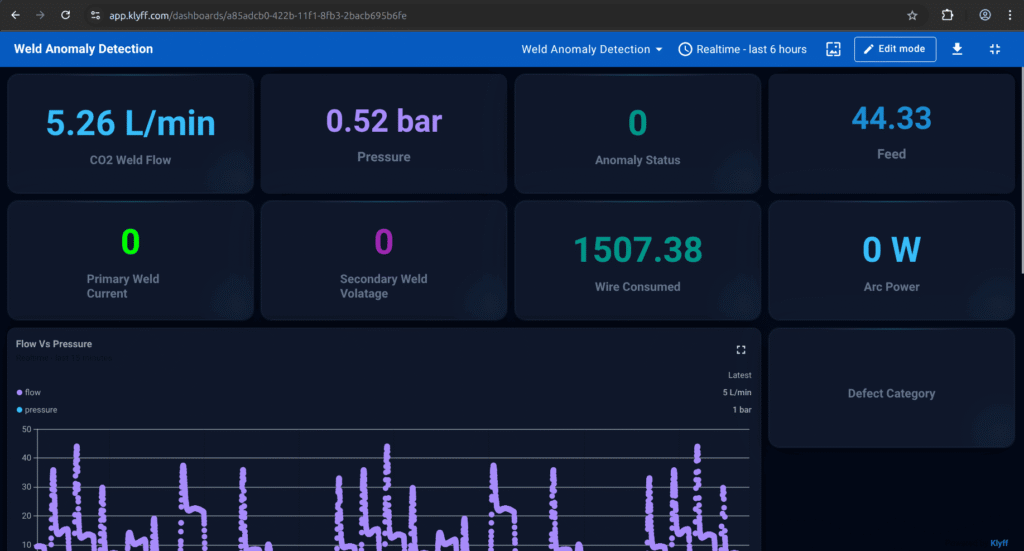
Instead of sending raw data streams to the cloud, the system produces structured, decision-ready telemetry at the source. Analyzr visualizes this telemetry, providing real-time and historical visibility into weld performance across lines and devices. Inspeqtr surfaces detected anomalies and drives automated quality inspection dashboards, alerts, and defect tracking.
System Architecture
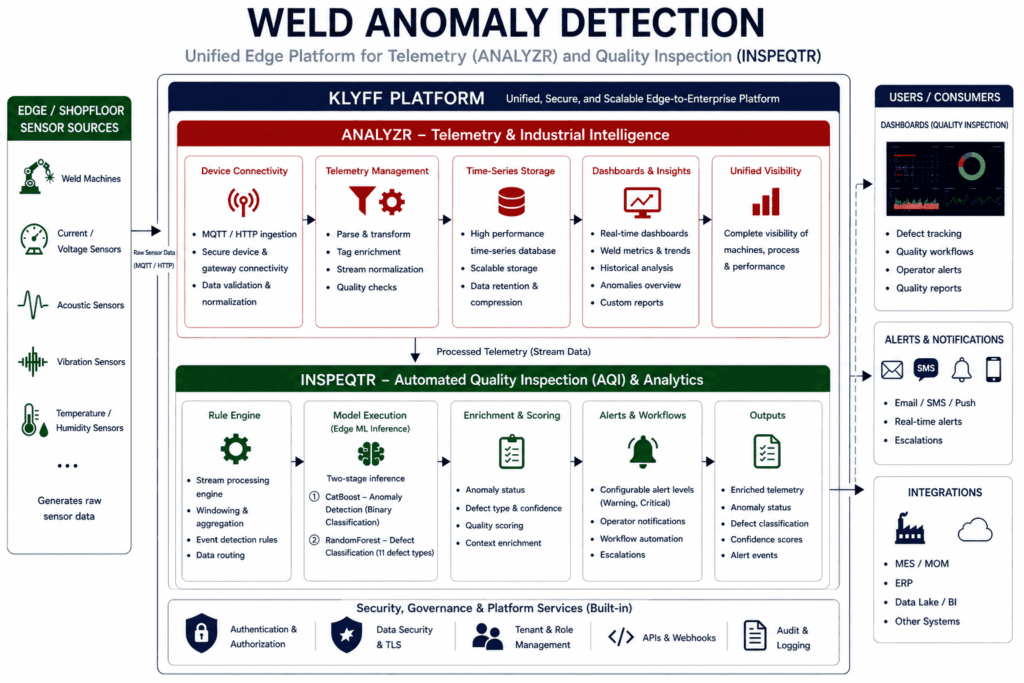
The Klyff platform implements this system using a modular edge architecture designed for real-time industrial intelligence.
Weld sensor data is continuously ingested and processed into structured insights. Analyzr serves as the telemetry backbone — collecting, storing, and visualizing both raw and processed weld data. Inspeqtr surfaces anomaly signals and powers automated quality inspection workflows, defect tracking, and operator alerts.
The architecture deliberately breaks down into smaller services rather than operating as a single monolithic application. This allows for easy debugging and maintenance of the application. If ingestion is not successful, one looks at the MQTT and Telegraf. If there is no output from the model, then one looks at the Kapacitor, the UDF plugin, and the Time Series Analytics services.
| Container | Responsibility | Why it matters |
| ia-mqtt-publisher | Reads weld CSV data and publishes JSON messages. | Simulates real weld machine telemetry during development. |
| ia-mqtt-broker | Runs Eclipse Mosquitto. | Decouples data producers from analytics consumers. |
| ia-telegraf | Subscribes to MQTT and forwards metrics. | Converts MQTT payloads into time-series measurements. |
| ia-influxdb | Stores raw and processed measurements. | Provides historical inspection and dashboard data. |
| ia-time-series-analytics-microservice | Runs Kapacitor, UDF deployment, and stream analytics. | Hosts the real-time inference workflow. |
| nginx | Provides HTTPS and REST proxying. | Gives an external entry point for UI and API access. |
| ia-klyff | MQTT bridge. | Sends telemetry data to Klyff |
From Weld Sensor Data to an Edge Decision
The system integrates with real-world welding environments and continuously collects sensor data from machines, PLCs, and edge gateways. This data includes both normal and defective weld patterns, such as Good weld, Burn-through weld, Crater cracks, Excessive convexity, Excessive penetration, Lack of fusion, overlap, porosity, spatter, undercut, and warping weld.
The system structures and streams incoming telemetry in real time, forming the foundation for Analyzr to provide live and historical visibility into weld performance across lines and devices.
An example telemetry payload:
{ "Pressure": 1.56,
 "CO2 Weld Flow": -0.11,
 "Feed": 0,
 "Primary Weld Current": 0,
 "Wire Consumed": 3.44,
 "Secondary Weld Voltage": 0,
 "source": "mqtt-publisher-1"
}
Input Data Contract
The model expects structured weld process data with specific field names and formats. Maintaining this contract consistently is critical, as the model trains on these exact features.
Key fields include:
- Pressure, CO₂ Weld Flow, Feed, Wire Consumed – capture process and material behavior
- Primary Weld Current – indicates active welding and drives classification
- Secondary Weld Voltage – reflects voltage behavior during welding
- source – identifies the machine or simulator
- filename – helps trace simulation data
This structured telemetry feeds into Analyzr. Inspeqtr uses the same standardized inputs to perform accurate anomaly detection and defect classification.
MQTT Ingestion and Processing in Klyff
The Klyff platform directly ingests weld sensor data using MQTT and maps incoming telemetry into a standardized data model within Analyzr.
[[inputs.mqtt_consumer]]
servers = ["tcp://$MQTT_BROKER_HOST:1883"]
topics = ["weld-simulation-data"]
name_override = "weld-sensor-data"
data_format = "json"
json_string_fields = ["source", "filename"]
The topic name is weld-simulation-data, but Analyzr stores the measurement as:
weld-sensor-data
This distinction is important because the Kapacitor TICKscript listens for the measurement name, not the MQTT topic name.
Time Series Analytics Configuration
The model and UDF configuration are managed within the Klyff platform as part of its built-in rule engine and model execution framework.
This development configuration defines which model and UDF should be executed for incoming telemetry within the platform.
{
"udfs": {
"name": "weld_anomaly_detector",
"models": "weld_anomaly_detector.cb"
},
"alerts": {
"mqtt":   {
"mqtt_broker_host": "ia-mqtt-broker",
"mqtt_broker_port": 1883,
"name": "my_mqtt_broker"
    }
  }
}
This configuration specifies:
The model/UDF used for anomaly detection
The alerting mechanism that can publish results to MQTT or trigger platform-level alerts.
Within Klyff, the system implements this logic through the rule engine and Inspeqtr, applying models directly to incoming telemetry.
During deployment, the system packages and prepares model artifacts and configurations for integration into the platform.
udfs/
tick_scripts/
models/
The Klyff platform deploys these artifacts, registers them within the rule engine, and makes them available to Inspeqtr for real-time execution.
The Models: What Actually Runs at the Edge
The edge inference pipeline uses two models in sequence — not one. This two-stage design separates the fast binary gate from the detailed defect classification.
Incoming weld point
   → CatBoost: Is this anomalous?
      → No  → Pass through, no alert
      → Yes → anomaly_status = 1.0, alert fired
                → RandomForest: What defect type is it?
                   → Defect category + confidence score
                   → Dashboard label + quality report entry
Binary Anomaly Detection with CatBoost
The first model is a CatBoost-based classifier that determines whether a weld is normal or anomalous. The system optimizes performance for speed and reliability at the edge.
Why is the Primary Weld Current checked first?
Before running inference, the system checks whether the weld arc is actually active:
WELD_CURRENT_THRESHOLD = 50If Primary Weld Current is below 50 A, the system skips inference entirely. Without this gate, idle periods would be fed into the model and misclassified as anomalies, inflating false positive counts. With the gate, inference focuses only on active weld activity.
When the current is above the threshold, the model calculates probabilities:
defect_likelihood_main = self.model.predict_proba(point_series)
bad_defect = defect_likelihood_main[0] * 100
good_defect = defect_likelihood_main[1] * 100
If the defective probability exceeds 50%, the system marks the point as anomalous.
if bad_defect > 50:
                point.fieldsDouble["anomaly_status"] = 1.0
For dashboards and alerts, the anomaly status is the easiest signal to act on. For engineering analysis, the raw probabilities are still valuable because they show how close the model was to the decision boundary.
Multi-Class Defect Classification with RandomForest
If a weld is identified as anomalous, a second model performs multi-class defect classification. This model distinguishes between defect types such as porosity, burn-through, cracks, lack of fusion, and others.
Why RandomForest for defect classification
RandomForest is well-suited here because the feature space is small, the class distribution across different defect types can be uneven, and the model handles these characteristics without extensive hyperparameter tuning. The StandardScaler step normalizes each feature to zero mean and unit variance essential because features like Primary Weld Current (50–300 A) and CO₂ Weld Flow (-1 to 20 L/min) operate on very different numeric scales.
def build_pipeline() -> Pipeline:
    clf = RandomForestClassifier(
        n_estimators=60,
        max_depth=14,
        min_samples_leaf=8,
        max_features="sqrt",
        n_jobs=-1,
        random_state=42,
    )
    return Pipeline([("scaler", StandardScaler()), ("clf", clf)])
Training, evaluation, and saved artifacts
The model is trained and evaluated with:
pipeline = build_pipeline()
pipeline.fit(X_train, y_train)

y_pred  = pipeline.predict(X_test)
acc     = accuracy_score(y_test, y_pred)
report  = classification_report(y_test, y_pred, target_names=class_names, digits=4)
cm      = confusion_matrix(y_test, y_pred)
After training, the model, label encoder, and metadata are exported as deployable artifacts. These files include the serialized classifier, the label mapping used to decode predictions, and a JSON file containing feature names, class labels, and training metadata. These artifacts are then deployed into the Klyff platform, where they are executed in real time through Inspeqtr using Klyff’s rule engine.
joblib.dump(pipeline, MODEL_OUT, compress=MODEL_DUMP_COMPRESS)
joblib.dump(le, LABELS_OUT, compress=MODEL_DUMP_COMPRESS)
model_info = {
"model_file": str(MODEL_OUT),
"labels_file": str(LABELS_OUT),
"features": FEATURES,
"classes": list(le.classes_),
"good_weld_label": "Good Weld",
}
Inference in the UDF
After the binary flag is set, the UDF loads the defect classifier and assigns a specific category:
if bad_defect > 50:
    point.fieldsDouble["anomaly_status"] = 1.0
    defect_class = self.defect_classifier.predict(point_series)[0]
    point.fieldsString["defect_type"] = defect_class
The current threshold must match between training and inference
The training script uses MIN_WELD_CURRENT = 50.0. The UDF uses WELD_CURRENT_THRESHOLD = 50. These must remain identical. If the threshold changes in training but not in the UDF, the model is trained on data it never sees at inference time, a distribution mismatch that silently degrades production performance. Treat this value as a shared contract between the training pipeline and the inference pipeline.
Klyff Integration & Alerting
Detected anomalies are forwarded to the Klyff platform via an MQTT forwarder:
configs/klyff/forward.shThe forwarder subscribes to local MQTT topics and republishes telemetry to the Analyzr ingestion topic:
v1/devices/me/telemetryAuthentication uses the device token configured as:
DEVICE_TOKEN=<device_token>The Klyff rule engine provides flexibility to configure alert behavior:
- Modify alert conditions based on thresholds, probabilities, or signal combinations
- Route alerts to MQTT, dashboards, or external APIs
- Customize alert payloads for downstream applications
- Define multiple alert levels (warning, critical)
You can find the complete source code on GitHub: https://github.com/KlyffHanger/Inspeqtr-WeldAnomaly
Conclusion
Weld anomaly detection is a critical industrial use case where speed, reliability, and local decision-making are essential. This system demonstrates how a complete edge-based pipeline can detect multiple weld defect types in real time — without cloud inference.
By leveraging the Klyff platform, Analyzr handles telemetry and visibility while Inspeqtr performs automated quality inspection and model execution. Together, they deliver real-time insights, improve product quality, and enable faster operational decisions across manufacturing environments.
Get in touch with us to explore how automated quality inspection can be applied to your welding, manufacturing, and industrial monitoring scenarios.