
Adaptive Predictive Maintenance
On device inference becomes inaccurate with each passing day. Read how Klyff handled on-device training to keep your models accurate.

Solder Joint Inspection
Read how Klyff helped reduce false positive rate to <2% and reduce latency from 120ms to 8ms thus resulting in huge cost advtange

PPE Compliance in Chemical Plant
Klyff helped a global chemical manufacturer to ensure all workers wore Hazmat suits and respirators in "Zone 1" areas through federated learning
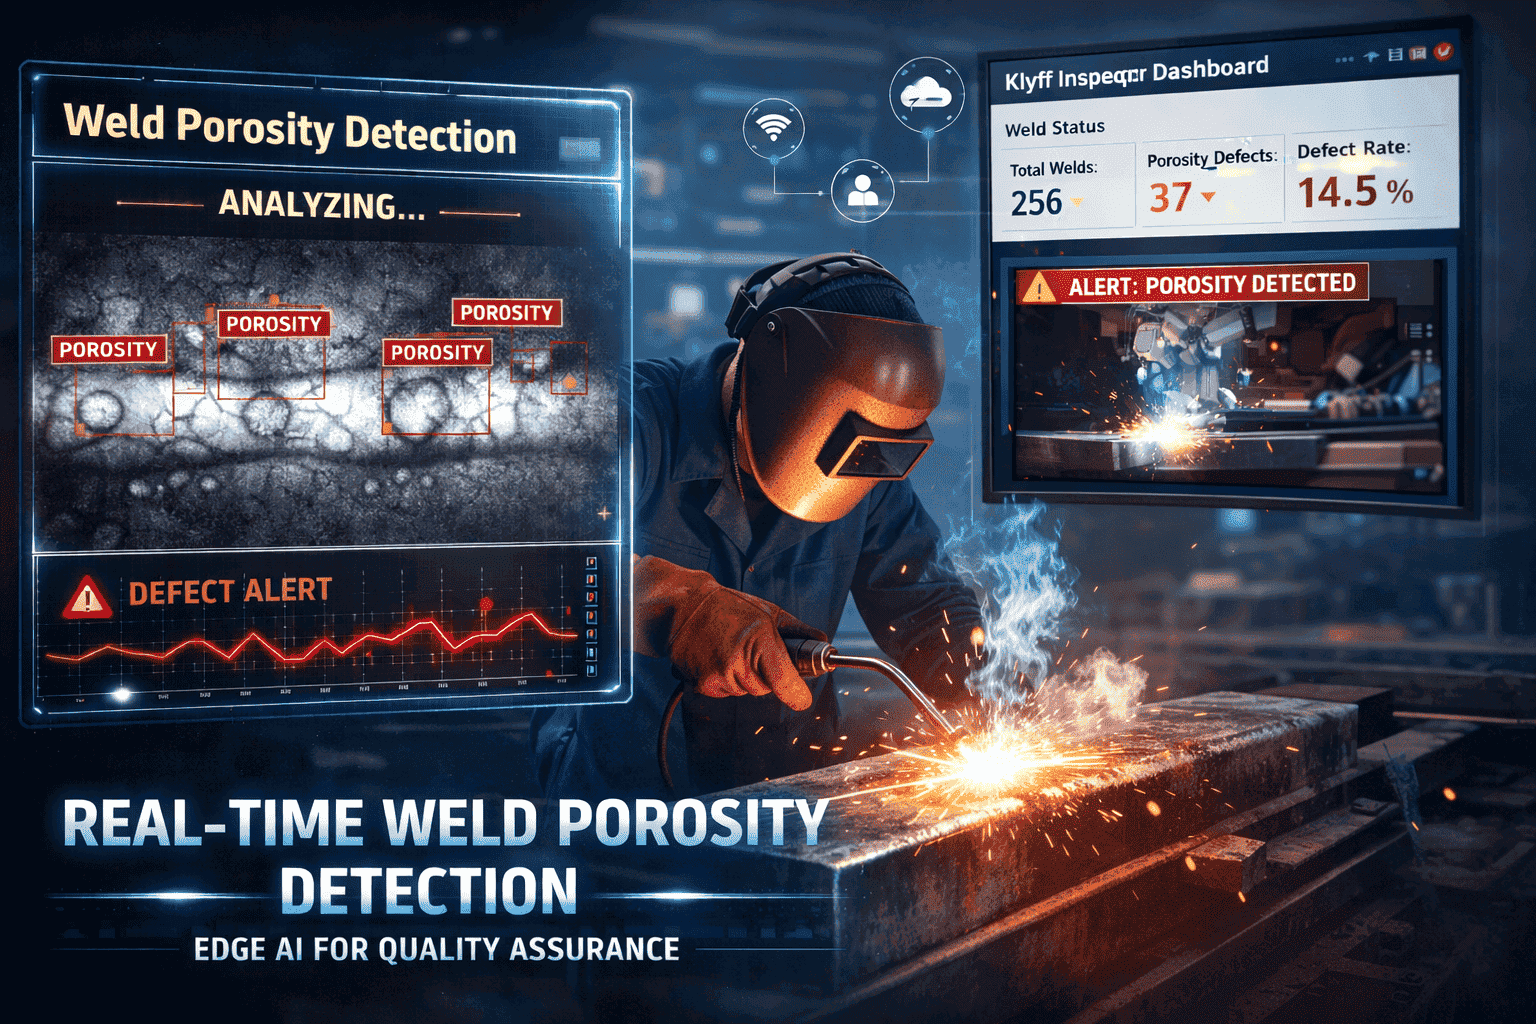
Real-Time Weld Porosity Detection Using Edge AI
Most welding lines still rely on manual inspection or post-process testing. Inspectors visually check weld beads, look for defects, and...
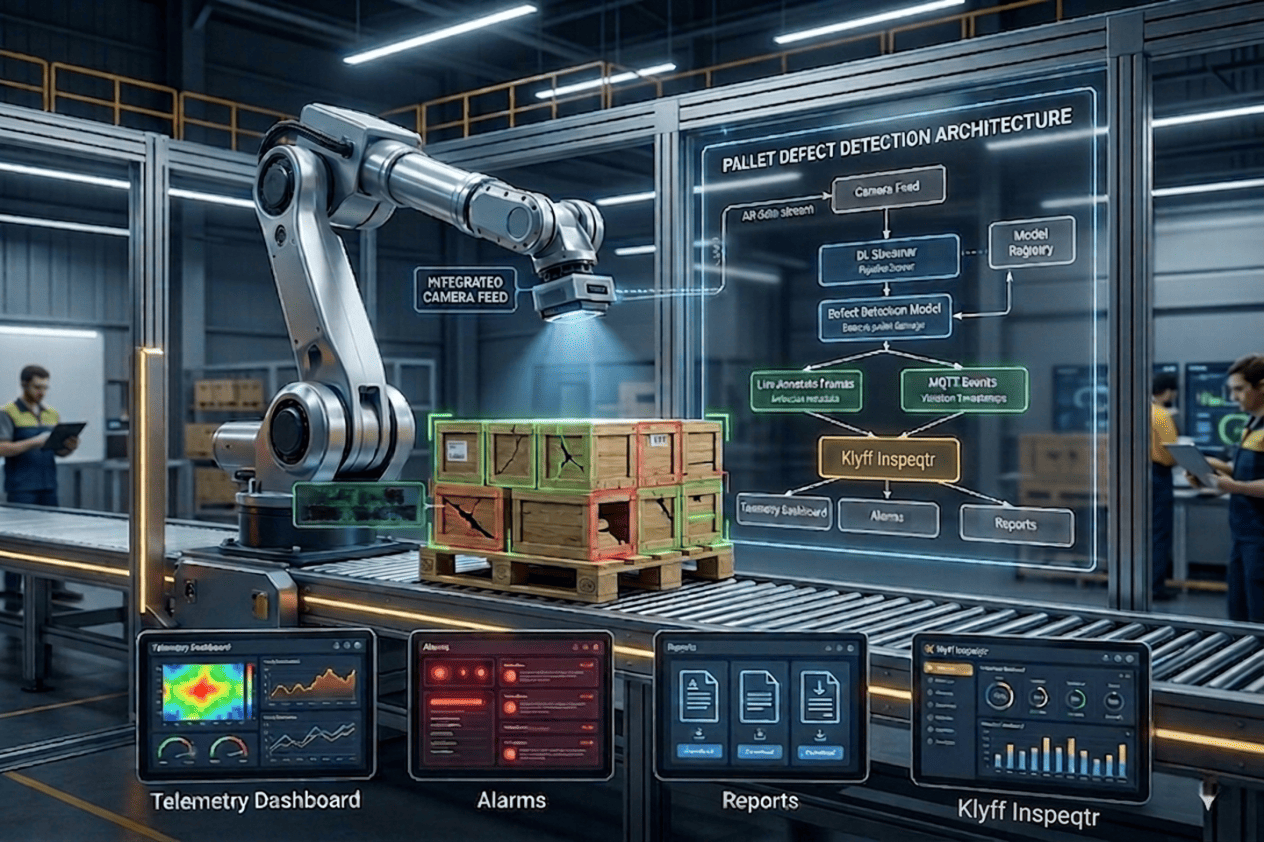
Pallet Defect Detection
In modern manufacturing and logistics, Pallet Defect Detection plays a critical role in maintaining supply chain efficiency. Pallets are the...
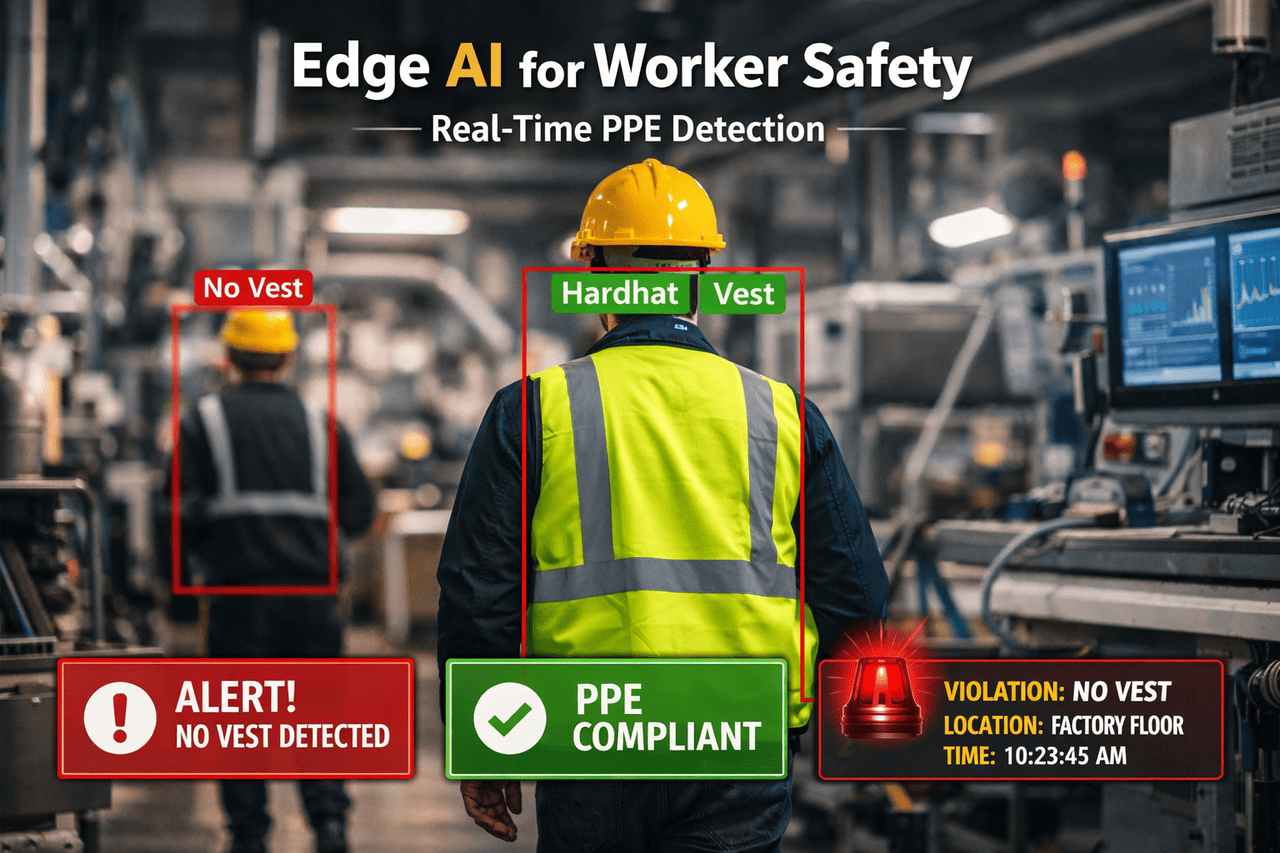
Edge AI worker safety system
Safety incidents happen fast. In many cases, by the time an alert travels from your factory floor to the cloud...