In the previous post, we understood how to frame a problem to validate whether it is a candidate for Edge AI or not. In this post, we will look at the importance of a great dataset.
Datasets are absolutely crucial for machine learning projects where data is used to train models, however, it is important in an Edge AI application even if it does not need machine learning. It is needed to select effective signal processing techniques, design heuristic algorithms, and test the application under realistic conditions. This is the most difficult, time-consuming, and expensive part of any Edge AI project.
A Dataset
It is a collection of records that contain valuable pieces of information called features. Each feature can be a different data type, such as numbers, time series, images, etc. In a table analogy, records are rows and features are columns or fields. Labels are special kinds of features that indicate the desired output for a model trained on that data set. The dataset may contain metadata, that is the description of the data. For example, a sensor data record may contain the model number of the exact sensor from which the data was collected.
Ideal Dataset
- Relevant – information relevant to the problem that we are trying to solve
- Representative – varied conditions that might be encountered
- Balanced – Good balance from all types of conditions
- Reliable – contains as few errors as possible. Any noise in data should be of the same magnitude that would be encountered in real-world
- Well formatted – consistent formatting
- Well documented – where the dataset came from, how it was collected, and what all the fields mean
- Well-sized – Machine learning models perform better when they are trained with large sets of relevant data
Data quality can only be judged by domain experts. It is necessary to have domain experts on your team who can validate the quality of the data. They may not be building and working with data but they alone would be able to tell whether the dataset is valid or not.
Dataset Quality
Data quality plays a vital role in the algorithm’s performance. Cleaning up data includes removing outliers, fixing mislabeled samples, adding synthetic data to improve representation, resampling data to improve balance, and adding or removing data to account for drift. This maintenance of data needs domain expertise. Data cleaned this way allows the model to be trained effectively and reduces the amount of data required.
A high-quality dataset with fewer samples is often superior to a low-quality dataset that has more.
Dataset Quantity
Data requirements of ML projects are much higher than signal processing, heuristics, and hand-coded algorithms. In those cases, data is needed mostly for testing. Deep learning models on the other hand need more data than their ML counterparts. Papers with code list benchmark datasets for various tasks and the performance attained over time. For example, the Google Speech command dataset has been solved with an accuracy of 98.37%
The following table provides approximate data required to train ML models for common tasks

Process for estimating data requirement
The following 6 steps should be followed for building a dataset and coming at a conclusion on how much data might be needed
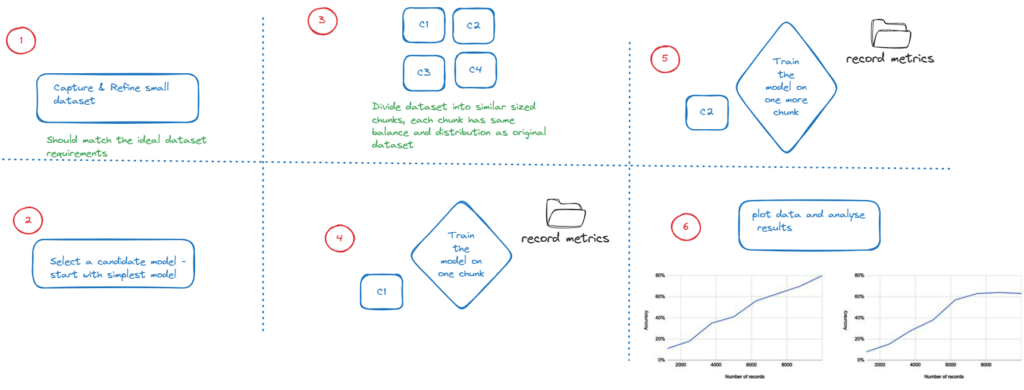
If in step 6 the chart looks like the one on the left then that means that adding every new chunk of data is helping improve the accuracy so we should keep adding data. Where as the chart on the right shows that the graph has plateaued and adding new chunks of data is not adding much value so we can stop.
Sometimes when data is not readily available or difficult to obtain, the alternative might be synthetic data. This data is created artificially using simulation with virtual sensors, procedural with algorithms or generated images directly from deep learning models
Data Storage
As we start collecting data, it needs to be stored somewhere. Typical locations include SQL databases, time series databases, log files, data warehouse and lakes, cloud services, IoT platforms etc. For your models you might want to pull out data from more than one of these locations.
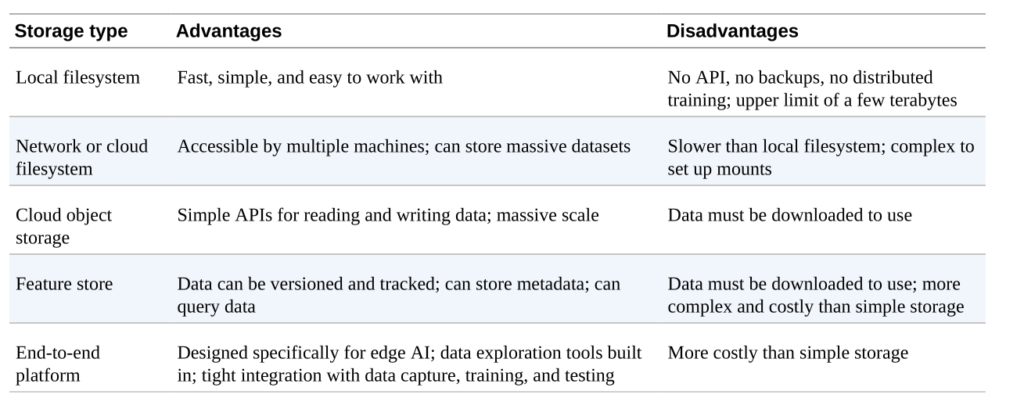
Data stored locally is the fastest. Network file systems like Amazon FSx, Szure files, and Google Cloud filestore. Cloud services like Amazon S3, Azure blob storage, and Google Cloud storage. Feature stores allow easy storage and access of data through APIs along with data versioning and the ability to query data like Amazon Sagemaker FS, Azure Databricks feature store, and Google Cloud vertex ai feature store.
Metadata
Metadata is important along with the data. Attributes like time and date of data collection, specific device number and model number, location of the device, and people associated with data collection are some of the important metadata. This metadata can be associated with individual samples. The dataset can be split on the basis of metadata as well. Collecting metadata allows you to understand the makeup of the dataset and where we are missing representation and balance, for example, it might show that data from people of color does not include enough brown representation. During the evaluation of the system, we are able to understand weak areas of the model in terms of subgroups of the dataset.
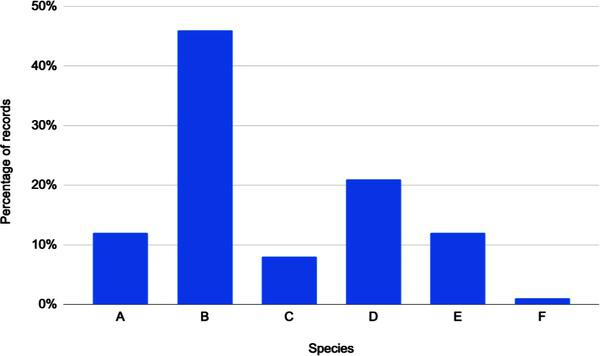
For example, the above graph shows the distribution across metadata attributes. It is easy to see that the data is not balanced and is biased toward B with almost no representation of F.
Time is an important attribute in looking at metadata. For plants, animals, waves, wind patterns, etc apart from the location of data collection, it is also important to consider the time or seasonality of this data. For all the above the patterns might be very different in spring versus winter.
Sampling of data
For a given dataset, a sample of sufficiently sized records will have the representation and balance as a larger dataset
The formula used to calculate the sample size is called Cochran’s sample size formula
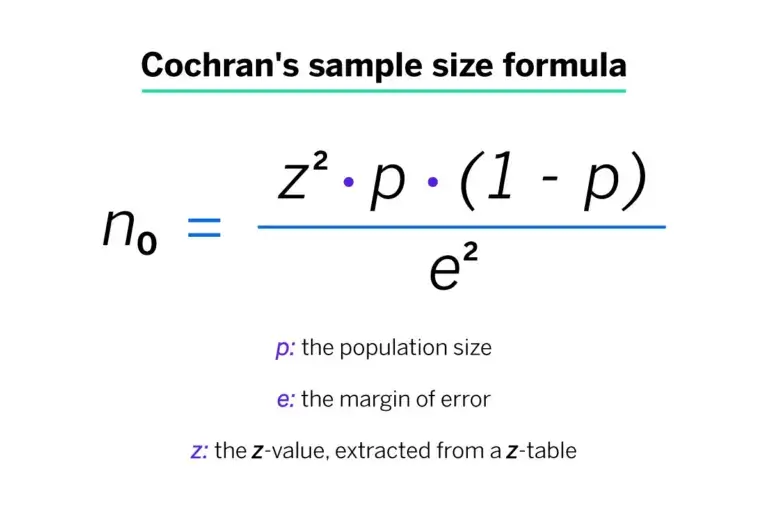
Here Z score represents the confidence level. A reasonable confidence level is 95% which is a Z score of 1.96. See here for Z scores
Standard deviation is how much we would like the data to vary. It is safe to put it as 0.5 It is normal to consider the margin of error as 5% which means that it is either 2.5% higher or lower than the ratio in the entire dataset

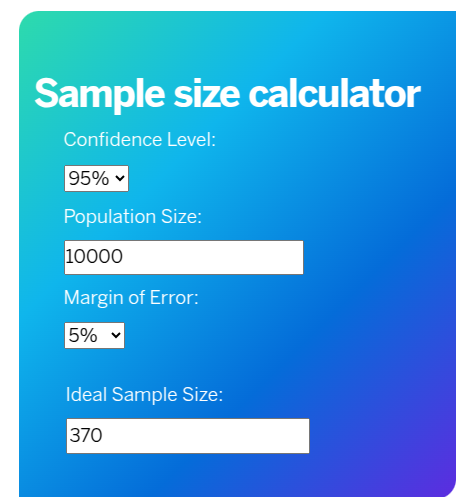
Putting these values in this calculator gives us the sample size that we should be considering
Label Noise
Labels are the values that we are trying the AI to predict. Most data is labeled by humans and statistically, there is a 3.4% error in labeling. There are various tools available that help you uncover the issues in your labeling
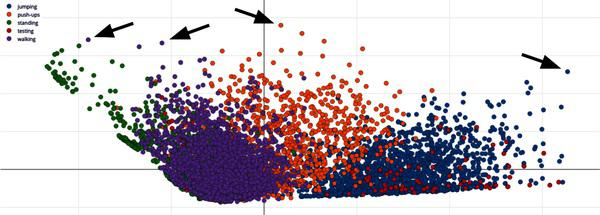
It is good to understand the outliers when the data is mapped in a 2D space. These data points could have been potentially mislabeled.
Common data errors
- Label Noise – incorrect labeling
- Missing values – records in the dataset might be missing values for some features
- Sensor issues – incorrect calibration, technical issues, changes in ambient conditions
- Incorrect values – transmission errors
- Outliers
- Incorrect scaling – 2 sensors have been scaled differently, one in Celsius and the other in Fahrenheit
- Incorrect representation – data values represented in a format different from what was expected, for example, audio file compressed as mp3 instead of raw buffer
- Unexpected rates – some data collected at 8kHz and other at 16kHz
- Tampered data – when collecting data from the field it is better to cryptographically sign samples so that the authenticity of data is ensured before storage
Another aspect to keep in mind is the distribution of errors. If there is 1% sample noise then that might be acceptable. However, is this 1% all comes from 1 of the 10 classes then we have a problem. This would be enough to impact the accuracy of the model. Errors could also be asymmetric across the subgroups. For example, if we collected inputs from 3 sensors and if one of the sensors was faulty then the model still might not be accurate.
Drift
When drift occurs then the dataset is no longer a representation of the real world. Hence, any model based on the dataset would be erroneous. Drift can be sudden when say a machine is moved from one location to another and hence the background noise and vibration data changes. It can be gradual when the data changes because of wear and tear in the machinery or it can be cyclic based on the seasonality as the temperature or the humidity levels change around the machine
Drift is bound to occur and is inevitable. Managing drift requires the dataset to be updated periodically so that it incorporates the drift. Thanks to drift, an AI project is never finished but needs ongoing maintenance.
Preparing Data – the Journey
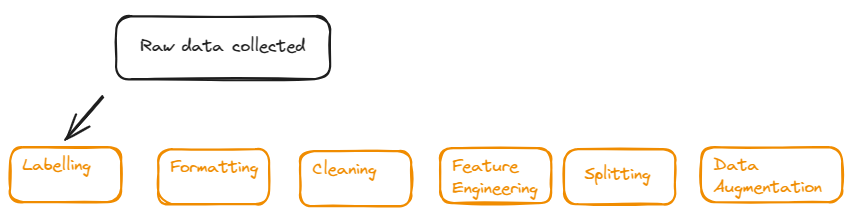
Labeling
- Any AI dataset contains the mapping between a set of raw inputs and a description of what they mean. Algorithms are trained to perform this mapping automatically. Labeling can be done on features, manually – tedious and error-prone, automatically – if you have access to the historically labeled dataset or a hybrid of the above approaches. Supervised algorithms require labeling, and unsupervised algorithms like training a clustering algorithm for anomaly detection does not need labeled data. It just learns from the innate properties of the unlabelled dataset.
- Semi-supervised learning – Start with an unlabeled dataset in which a small subset of data is labeled. The model is trained on the labeled dataset. The model is used to predict labels for some of the unlabelled data, this labeled data is added to train the model. The process is repeated with more data until the model is good enough for production use.
- Active learning – Here in step 3, instead of automatically labeling a random set of sample data, the model is used to help select the records from the dataset that would be the most useful to label. A domain expert then labels them and they are fed back to the model

- The selection process ensures that there is maximum information gain when unlabelled samples are identified. There are 2 ways in which this is done. (a) Uncertainty sampling – where the model gives a confidence score on whether it has encountered similar samples or not, if it has then adding a similar sample might not add a lot of value Diversity sampling – statistical techniques to understand which samples best represent the underlying distribution of data
- Semi-supervised learning – Start with an unlabeled dataset in which a small subset of data is labeled. The model is trained on the labeled dataset. The model is used to predict labels for some of the unlabelled data, this labeled data is added to train the model. The process is repeated with more data until the model is good enough for production use.
- One major source of label noise is a bias that is introduced by humans or tools working with the data. Bias can come in with the domain expert who is relatively new to the dataset because the machines used in your dataset might be different from the ones that they are familiar with in the past.
- All efforts should be made to make a high-quality dataset. If it is beyond the budget and time to do so then the project must be aborted in the interest of not releasing a harmful system to production.
- Labeling tools – can help with the process of labeling which is the most time-consuming in an AI project
- Annotation tools – user interface to allow humans to label data. Some tools would assist by making boundaries along with objects that humans might be interested in
- Crowdsourced labeling – define a labeling task and then recruit members of the public to do it. To get good results education of the labelers and common rules are necessary
- Assisted and automated labeling – automation to help humans rapidly label large amounts of data. An object detection tool might build boxes around objects to be labeled or it might cluster similar types of data together so that it can be labeled.
- Semi-supervised and active learning – These methods reduce the amount of labeling that needs to be done by pulling out a small subset of data that needs to be labeled by hand in order to accurately provide automatic labels to the rest of the data. It is an iterative process where labeling of data, training a model, and labeling the next set of data go in iterations.

Formatting
Data preparation involves getting data from various data sources and converting them to a format that is of best use to the model
- Text – formats like CSV, and JSON are good for small data sets that can be entirely read into memory
- Image and audio files – JPEG, WAV files, etc. Stored as separate files on the disk
- Direct access binary formats – stores data in the native form of a sequence of binary bits than a secondary form like text. Allows any dataset to be accessed in constant time. NPY, Apache Parquet, etc
- Sequential binary formats – designed to maximize the efficiency of tasks like training machine learning models. They provide fast access in a specific, preset order. They are compact and very fast to read but not easy to explore like other formats. Used for large datasets and can result in cost savings. For example TFRecord
Manifest files contain an index to the rest of the dataset. Their common format is CSV. It is an easy way to keep track of all the data. To build a sample dataset one might select some rows from the manifest file at random.
Cleaning
Errors can creep into a dataset on account of outliers, inconsistent data formats, missing values due to joining of data from multiple sources, bugs in feature engineering
- Auditing the dataset – Pandas allows to explore and summarise datasets. Once the dataset is loaded into the pandas’ data structure, a data frame can be summarised that might point out the outliers.
- Fixing the issues – Any issues found in the dataset might be fixed by amending values, substituting values, or excluding the records completely which might be outliers or deemed faulty. The dataset should be balanced as well. So, if we find that one of the subgroups is unrepresented then it would mean that we need to collect more data for that subgroup.
Feature Engineering
Is an important step that will allow the Scaling of values so that they can be used as inputs to ML models, combining values to perform sensor fusion, and precomputing DSP algorithms so that the training runs faster.
Splitting
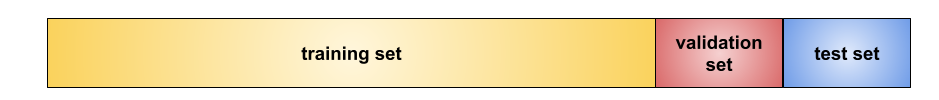
Data is split into 3 parts training, validation, and testing split. A common standard is to first split the data 80/20, with the 20% becoming the testing split. The 80% split is then itself split 80/20, with the 80% becoming the training split and the 20% becoming the validation. Each split should be a representative sample of the data as a whole.
The training dataset is used to develop the algorithm by training the ML model. The validation dataset is used to evaluate the model during iterative development. The testing dataset is used in the end as a final pass to ensure that the model works well on data that it has never encountered before.
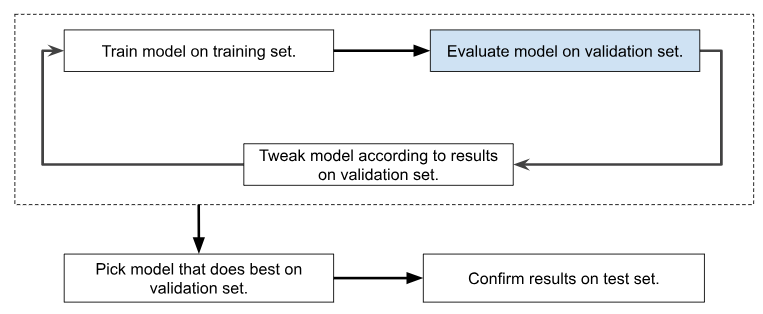
Overfitting is when the model works well with the data that it has been trained on but does not perform well when it encounters data that it has not seen before. So if it works at say 96% with training data and 74% with validation data then it is said to be overfitting with the training dataset and needs to be improved. Test split is sacrosanct and should not be used until we are ready with training and validation. If the model fails on a testing split then it is better to restart with a new model altogether.
Curating splits with the right balance is important. Scikit Learn has a good set of tools to perform data splits. Avoid duplicates, avoid changing the splits, agent if necessary only the training split, and do not touch the validation or testing split.
Augmentation
Works by introducing random artificial variations in the dataset that simulate the variations in the real world. It can be done before or after feature engineering
- Additive – incorporating extra signals from the real world like background noise
- Subtractive – removing chunks of time or frequency bands
- Geometric – rotating, shifting, stretching, spacial manipulation
- Filter-based – increasing or decreasing properties of individual values by random amounts
Since augmentation increases the amount of variation in the dataset, it can help the model generalize. Augmentation should only be applied to the training dataset. Augmentation is online or offline. Online is when the records are changed at the time of training. Offline is when it is changed and stored and then used to train the model.
Summary
Over the course of this post, we have seen the following considerations applied to data
- Capture
- Storage
- Evaluation
- Labeling
- Formatting
- Auditing
- Cleaning
- Sampling
- Feature engineering
- Splitting
- Augmentation
All these together constitute the data pipeline. The data pipeline should be implemented in a clean, well-documented, and versioned process. Any changes to the data pipeline have a downstream effect on the quality of the dataset. In Edge AI where there is a lot of complex sensor data, keeping good track of data pipelines is essential as to how the dataset was formed. Hence MLOps practices are very important to give the data pipelines the importance that they deserve.
Further, due to drift and shift, we may need to keep updating data. For this continuous injection of new data is needed else the model will start to degrade. Data collection might be a challenge if specialized hardware is needed and is only available temporarily for the training of the data, the data collection process is batch-based and not continuous, and data collection might be expensive. The risk of deterioration of the model due to drift and shift is unavoidable but the checks and balances should be built for dealing with it in time.